One year ago, we released a crowdsourced map tracking decreases in parking minimums across the country as part of #BlackFridayParking. Today we're sharing an update.
Read MoreOne year ago, we released a crowdsourced map tracking decreases in parking minimums across the country as part of #BlackFridayParking. Today we're sharing an update.
Read MorePlease take a few minutes to submit information about the parking minimums in your city so that we can share an updated map during the week of Black Friday Parking.
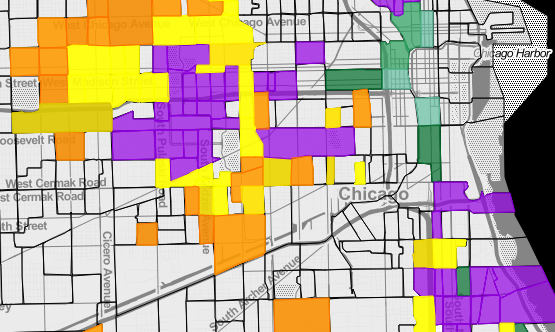
Read MoreThis interactive map lets you explore concentrations of suburban poverty and their growth over the last four decades.
Read MoreTwo weeks ago, we announced a crowdsourced database collecting information on the tax productivity of big box stores in comparison with other, more compact developments. We've now mapped that data for you to see.
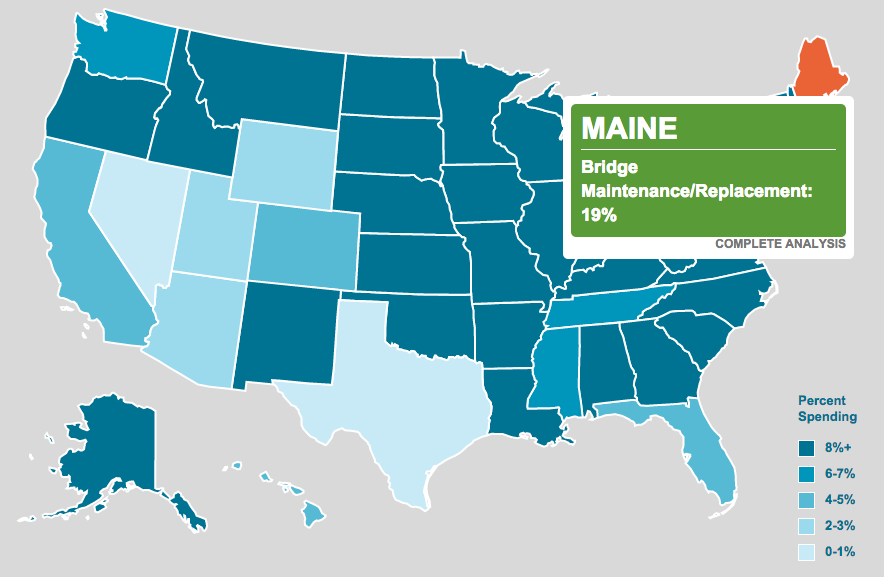
Read MoreWant to you calculate your state's transportation spending? How about identify distressed communities in your area? These mapping tools will help you do the job.
Read MoreToday we're sharing a fascinating, educational and free tool that you can use to compare transportation spending in all fifty states.
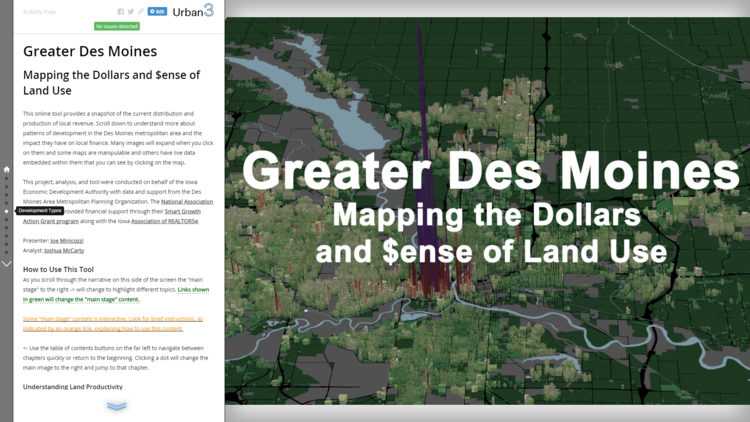
Read MoreUrban3 just released a brand new mapping tool. And we think you're going to like it.
Read MoreThese maps illustrate the way parking lots deplete your town's tax base and alter your landscape to detrimental effect.
Read MoreSee which cities are getting rid of parking minimums, from Miami to Portland.
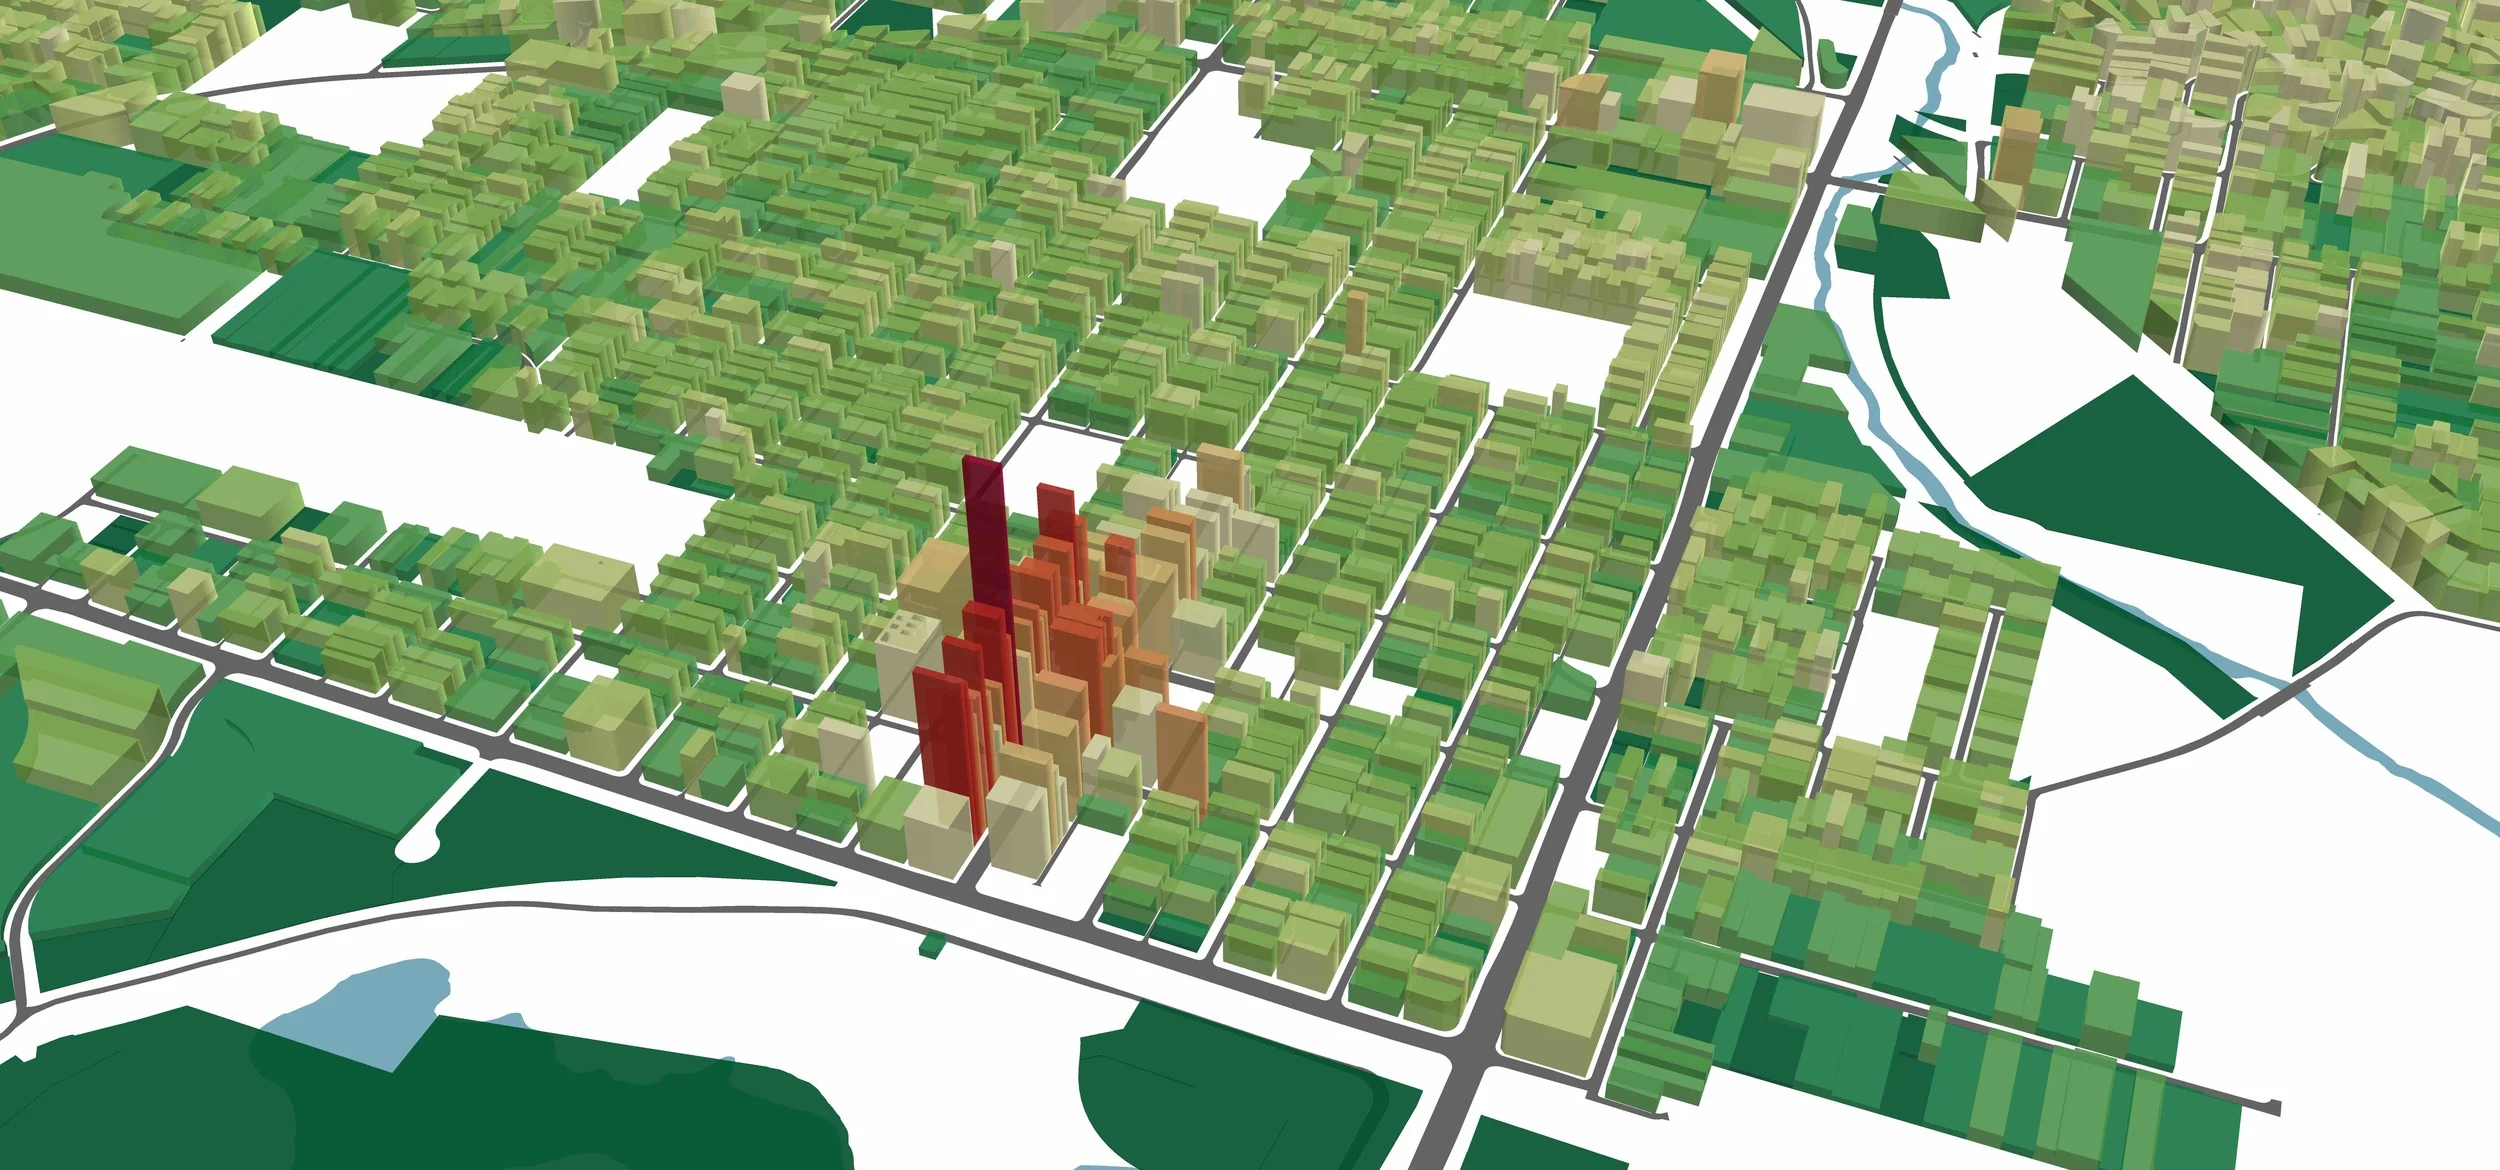
Read MoreJoe Minicozzi, principal of the econometric consulting firm Urban3, challenges assumptions about land use and development. With tools like basic arithmetic, maps, and 3D visualization using ArcScene and CityEngine, he makes the case against suburban sprawl and reaffirms the value of mixed-use urban development.
Read More